Architectures of the Kepler multi-transiting systems
For all the technical details, read our full paper: He, Ford, & Ragozzine (2019). Here, I aim to summarize and motivate the main ideas of this work, at a level that is accessible to the broader audience.
The Kepler mission
To date, almost 4000 exoplanets have been discovered and confirmed, with an additional couple thousand potential candidates yet to be verified (click here to keep up to date with the official numbers). A large majority of these exoplanets were discovered by the Kepler Space Telescope, the instrument central to the wildly successful mission of monitoring over 150 000 stars near continuously for several years in the search for transiting exoplanets. Although the telescope was launched almost a decade ago in 2009, and has since been recently decommissioned, Kepler’s wealth of data remains one of the most informative catalogues to study for advancing exoplanet science.
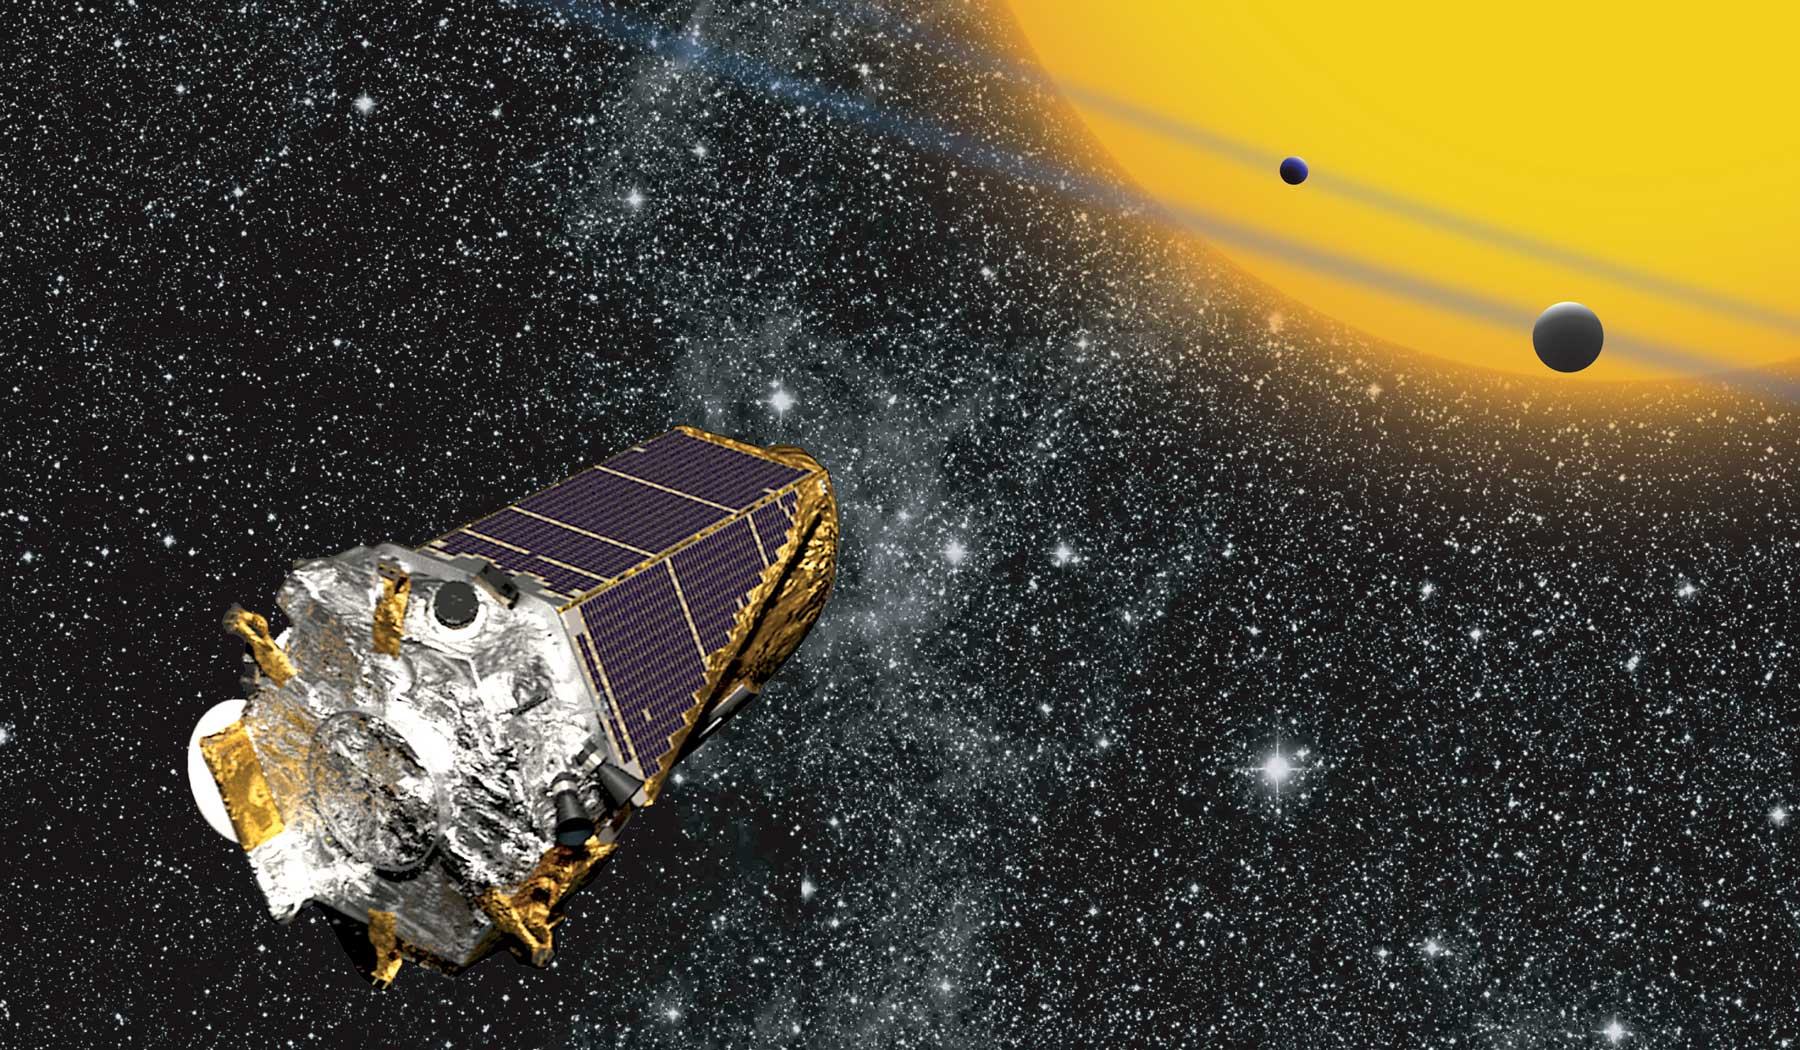
Artist’s depiction of the Kepler space telescope. In practice, Kepler pointed at a small patch of sky for its primary (4 year) mission and monitored the brightness of hundreds of thousands of stars. Image credit: NASA Ames
SysSim forward model
The Kepler dataset of transiting exoplanets is particularly valuable because it offers both a substantial sample of exoplanet detections, as well as a relatively uniform selection of target stars with well known observational biases that can be modeled. These properties make it ideal for systematically studying exoplanet demographics. This is exactly the focus of a project led by PIs Prof. Eric Ford (my advisor) and Prof. Darin Ragozzine — a framework for simulating catalogs of planetary systems via modelling the Kepler pipeline — and the codebase is available in our GitHub repository for ExoplanetsSysSim (which we call “SysSim” for short).
My research uses SysSim to forward model the observed data by generating ensembles of planetary systems in a statistical manner. The Kepler exoplanet catalog includes a rich sample of (over 600!) systems with multi-transiting planets, which offer key insights into their architectures (in this context, “architectures” refers to the physical properties of these systems, including things like how many planets are in each system, how their orbital periods and sizes are distributed, and how their orbits are configured).
What did we find?
In this paper, we develop three families of models for the distribution of planetary systems in order to:
- reproduce the observed Kepler data as well as possible,
- infer their underlying architectures (distributions of periods, sizes, orbital eccentricities and mutual inclinations, etc.), and
- explore the correlations in multi-planet systems (e.g. clustered periods, uniform spacings between planets, and similar sizes of planets in a given system).
Each model has a set of parameters which are physically motivated (things like the mean number of planets per system, the power-law indices for the period and radius distributions, the scale factors for the eccentricity and mutual inclination distributions, and so on). We find that our non-clustered provides a poor fit to the data: the correlations in periods and sizes are not captured and the number of multi-transiting systems is way off. Instead, we require a more sophisticated model in which planets are clustered in periods and in sizes.
Figure 1 in He, Ford, & Ragozzine (2019). Cartoon illustration of the three models we explored, from a non-clustered model to a model with clustered periods and planet sizes.
How did we fit the data?
In order to assess how good our models are, we defined a distance function that takes into account many observable quantities of the Kepler dataset. These are properties like the numbers of planets per system (observed multiplicity), the distribution of periods, transit depths, and transit durations, and the distributions of the ratios of these quantities for adjacent planet pairs. We chose to fit to these properties because they are well measured (relatively insensitive to measurement uncertainties arising from the stars) and probe many of the underlying properties in multi-planet systems.
Animation showing our best-fit clustered models compared to the Kepler data. Each panel contributes a distance term to the total distance function.
How did we find the best model parameters and their uncertainties?
Our models involve on the order of a dozen parameters each. We try to quantify the best-fitting values for these parameters as well as their uncertainties (in Bayesian parlance, this is called the posterior distribution). We do this by minimizing the distance function using a method called Approximate Bayesian Computing (ABC). Since it is relatively expensive to compute our full forward model millions of times, we train a Gaussian process emulator to each model which allows us to more quickly evaluate the distance function and thus explore the parameter space. We describe in more detail the background on Gaussian processes and how we used them on this page.
Figure 3 in He, Ford, & Ragozzine (2019). (Approximate) posterior distribution for the parameters of our clustered periods and sizes model, obtained using ABC with our Gaussian process emulator.
Open source software
You can access our GitHub repository for Clustered Planetary Systems if you wish to download our model catalogs, or even simulate your own catalogs!
Gallery of all systems with 3 or more observed planets, in the Kepler data and in a simulation from our clustered model. Can you guess which is which?